Partners: space4environment
Approach
Climate change poses several challenges to cities, such as droughts, urban heat waves, changing precipitation patterns, floods and (peri-)urban biodiversity loss. These impacts are interrelated with factors like land use activities around cities and the socio-economic setting.
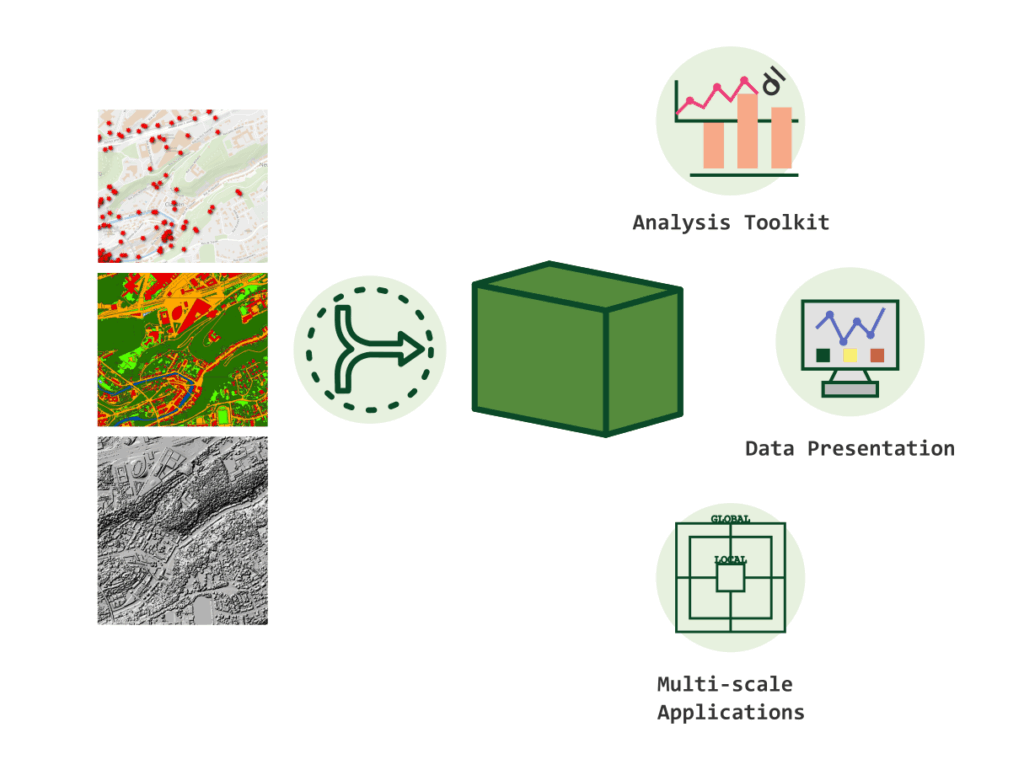
A persistent challenge in developing strategies for urban adaptation to climate change is the complexity of integrating and analyzing heterogeneous datasets with varying formats and quality. The UC1 approach addresses this issue through two key components: a process to harmonize diverse datasets into structured data cubes, and a comprehensive toolkit for their analysis and presentation. These tools support UC applications at multiple scales.
Overview of the UC1 offer
At the European level, they help identify cities with similar characteristics and analyze how different factors influence their adaptation capacity. Locally, specialized “city cubes” serve specific goals, as demonstrated through collaborations with Luxembourg City on managing invasive plant species and support provided to Vienna city initiatives.
The European Application
The European data cube contains data from the climate, land and socio-economic domains. Clustering analysis has been employed to discover cities that are similar with respect to the impact of climate change and their adaptation strategies.
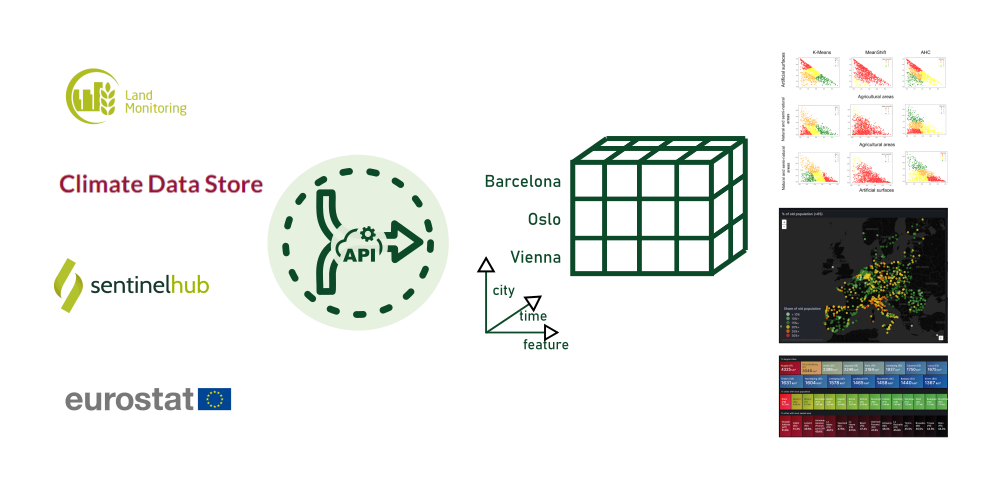
Overview of the European level application
Read more about the European application in the FAIRiCUBE Knowledge Base
Find the city features collection data cube in the Use Case GitHub repository
The local Application
At the local scale, we developed a high-resolution “urban-cube” combining environmental, ecological and climate data with the goal of monitoring the spread of invasive alien species in urban areas. The analysis was carried out for the Environmental Department of Luxembourg City, and used the city administrative boundary as study area.
Invasive alien plant species, also known as neophytes, are non-native species that spread aggressively in their new environment. Their spread is exacerbated by climate change. As part of their adaptation strategies, local administrations are seeking ways to efficiently monitor and mitigate their effects on local ecosystems and human health.
To predict where these aggressive non-native plants might appear next, our team combined real-world sightings from trusted nature databases such as mdata.mnhn.lu and GBIF.org with detailed information about local conditions throughout the city. We considered everything from temperature patterns and landscape features to how moist different areas typically are.
Using MaxEnt, a popular predicting model, we created detailed “plant potential” maps showing which city areas are most vulnerable to neophytes. These maps highlight hotspots where conditions are just right for these unwanted plants to flourish.
But knowing where these plants might grow is only half the battle. To truly protect Luxembourg’s natural spaces, we needed to understand why these plants thrive in certain areas. That’s why we added a model explainability layer that reveal which environmental factors matter most for each invasive species SHAP (SHapley Additive exPlanations.
This deeper dive into the data helps answer crucial questions for city planners: Will warmer summers give certain plants an unwelcome advantage? Do some invasive species prefer damp areas near water features? By understanding these relationships, cities can develop targeted strategies to protect the city’s natural beauty and biodiversity before problems take root.
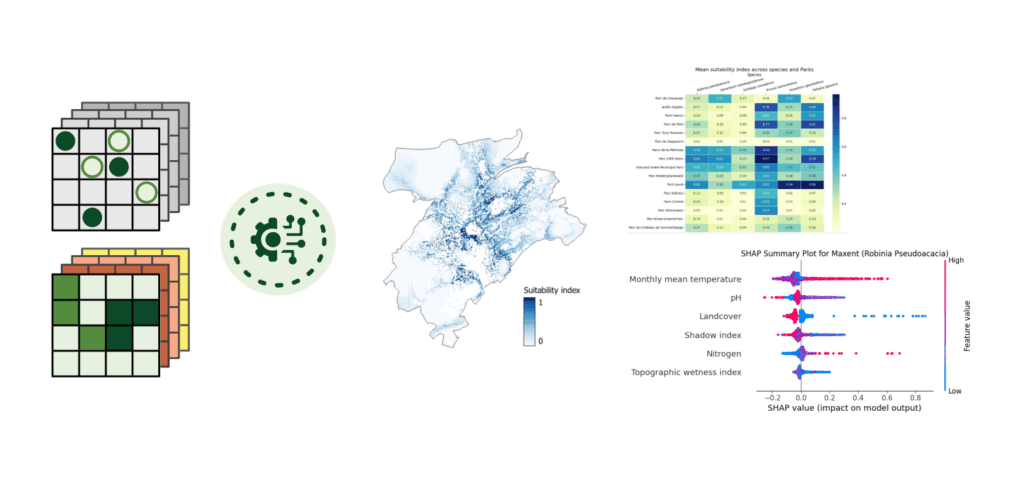
Overview of the local level application
– Read more about the local application in the FAIRiCUBE Knowledge Base
– Dive deeper in the data and outcomes in this interactive map