Climate change poses several challenges to European cities, such as droughts, urban heat waves, changing precipitation patterns, floods and (peri-)urban biodiversity loss. These impacts are interrelated with multiple other factors such as land use activities around cities and the local socio-economic setting. Large datasets on these factors are available, but they are complex to integrate and analyze due to their different sources, formats, and quality. Data cubes and the integration of data therein allow to assess their relationship and are, hence, an important building block for translating raw data into information.
The primary goal of FAIRiCUBE’s Use Case 1 called “Urban adaptation to climate change” is to furnish stakeholders from different levels (e.g., policy- and decision-makers, researchers, data scientists, urban planners, NGOs or the wider public) with a comprehensive “toolkit” to make well-informed decisions to address the multifaceted impacts of climate change.
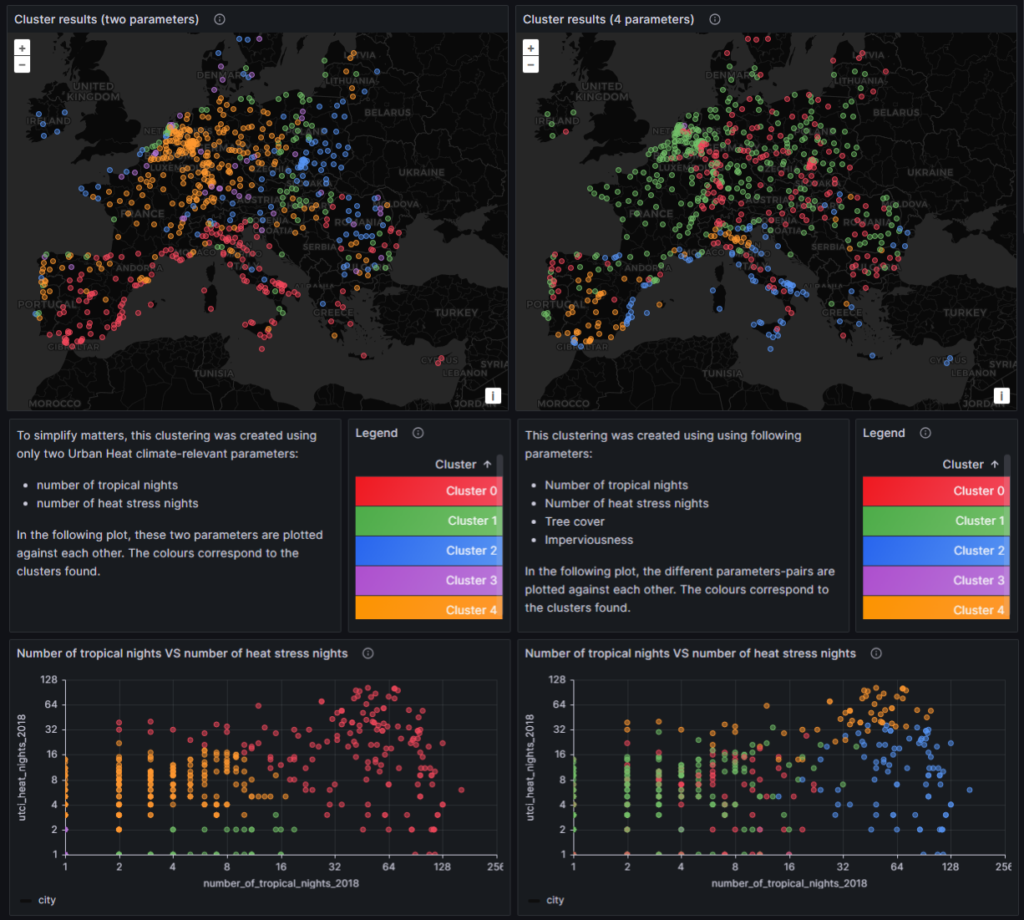
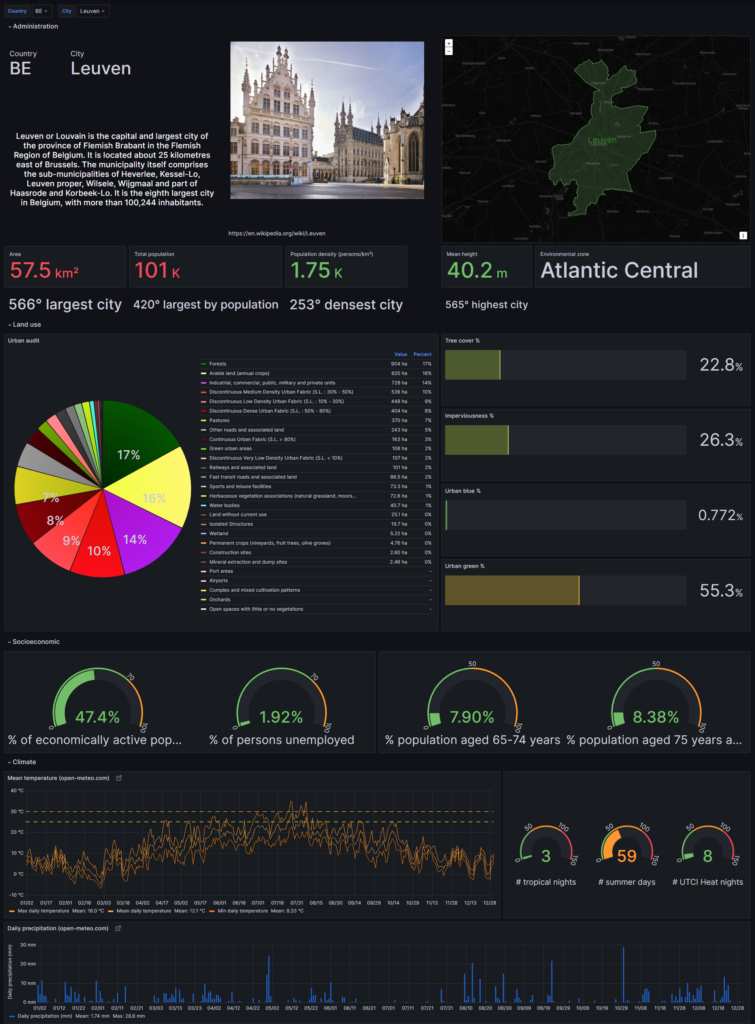
Dashboards (based on Grafana) presenting the collected data and their analysis results in a streamlined and easy-to-digest manner are for policy-makers that need to get the gist of the analysis without necessarily knowing the technical details. For example, one such dashboard shows the outcome of the cluster analysis of EU cities using data from the climate, land cover/land use and socio-economic domains. Along with the clustering analysis, we also prepared fact sheets to drill down on a single city and its status in 2018. Below is an example presenting the indicators for Leuven (BE). Such dashboards are based on the open-source software Grafana.
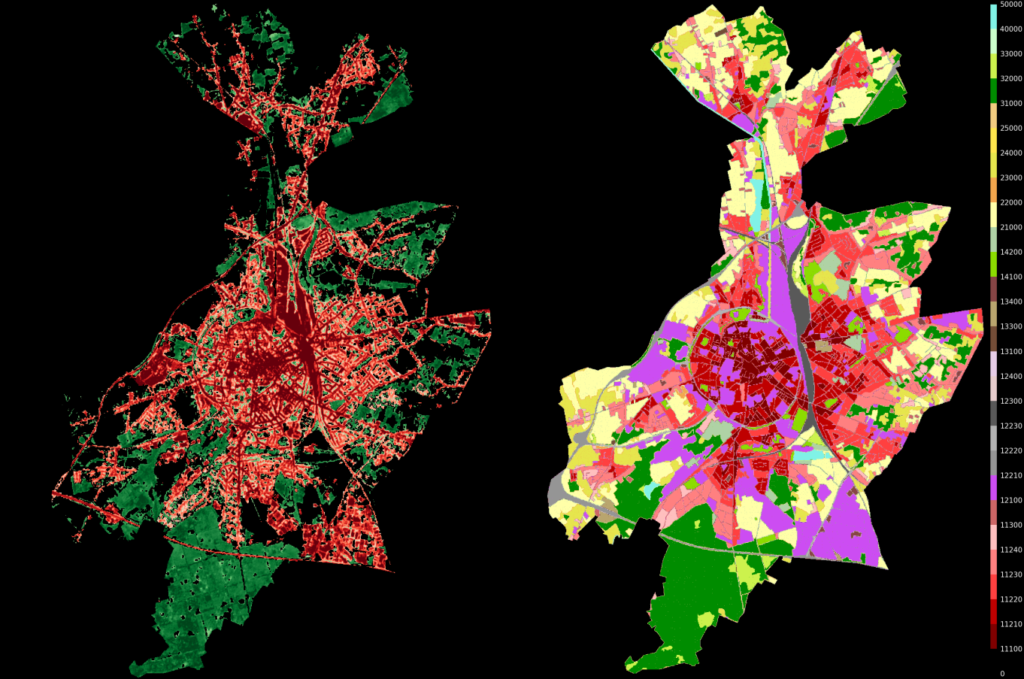
Interactive maps are a central part of the FAIRiCube system, allowing for in-depth data analysis and are suited e.g. to urban planners. Map visualization will be backed by the open-source software eodash, developed by FAIRiCUBE partner EOX. As an example, below CLMS Tree Cover density (green) overlayed to Imperviousness density (red), and Urban Atlas of Leuven (BE).
Finally, for researchers and data scientists that want to be as close to the process as possible, demo Jupyter notebooks and Python scripts are available on our public Github repository.
All the software is readily available within the FAIRiCUBE system.